
Technology
Dealership Analytics Dashboard Built for Fixed Ops Growth
Dealerwing helps franchised new car dealers see their customer data, service opportunities, campaign performance, and market potential in one clearer view. Our dealership analytics dashboard is designed to help leadership make smarter fixed ops marketing decisions based on clean data, accurate customer intelligence, and transparent reporting.
Most dealerships have more data than they can realistically use. The DMS, CRM, OEM feeds, recall data, service history, declined service records, customer contact records, and campaign reports all contain valuable information, but when those sources are disconnected, duplicated, outdated, or incomplete, the dealership does not have a clear picture of its true opportunity.
Dealerwing brings that information into focus. Our dashboard helps dealers identify flagged records, customer status, market opportunities, BDC follow-up lists, campaign audiences, and performance results so your team can stop guessing and start acting on better information.
The goal is simple: help your dealership turn customer data into service retention, fixed ops growth, and more measurable marketing performance.
Flagged records
Data quality directly shapes reporting accuracy. Dealerwing flags questionable records so leadership can see what needs attention before spending on it.
Customer status segmentation
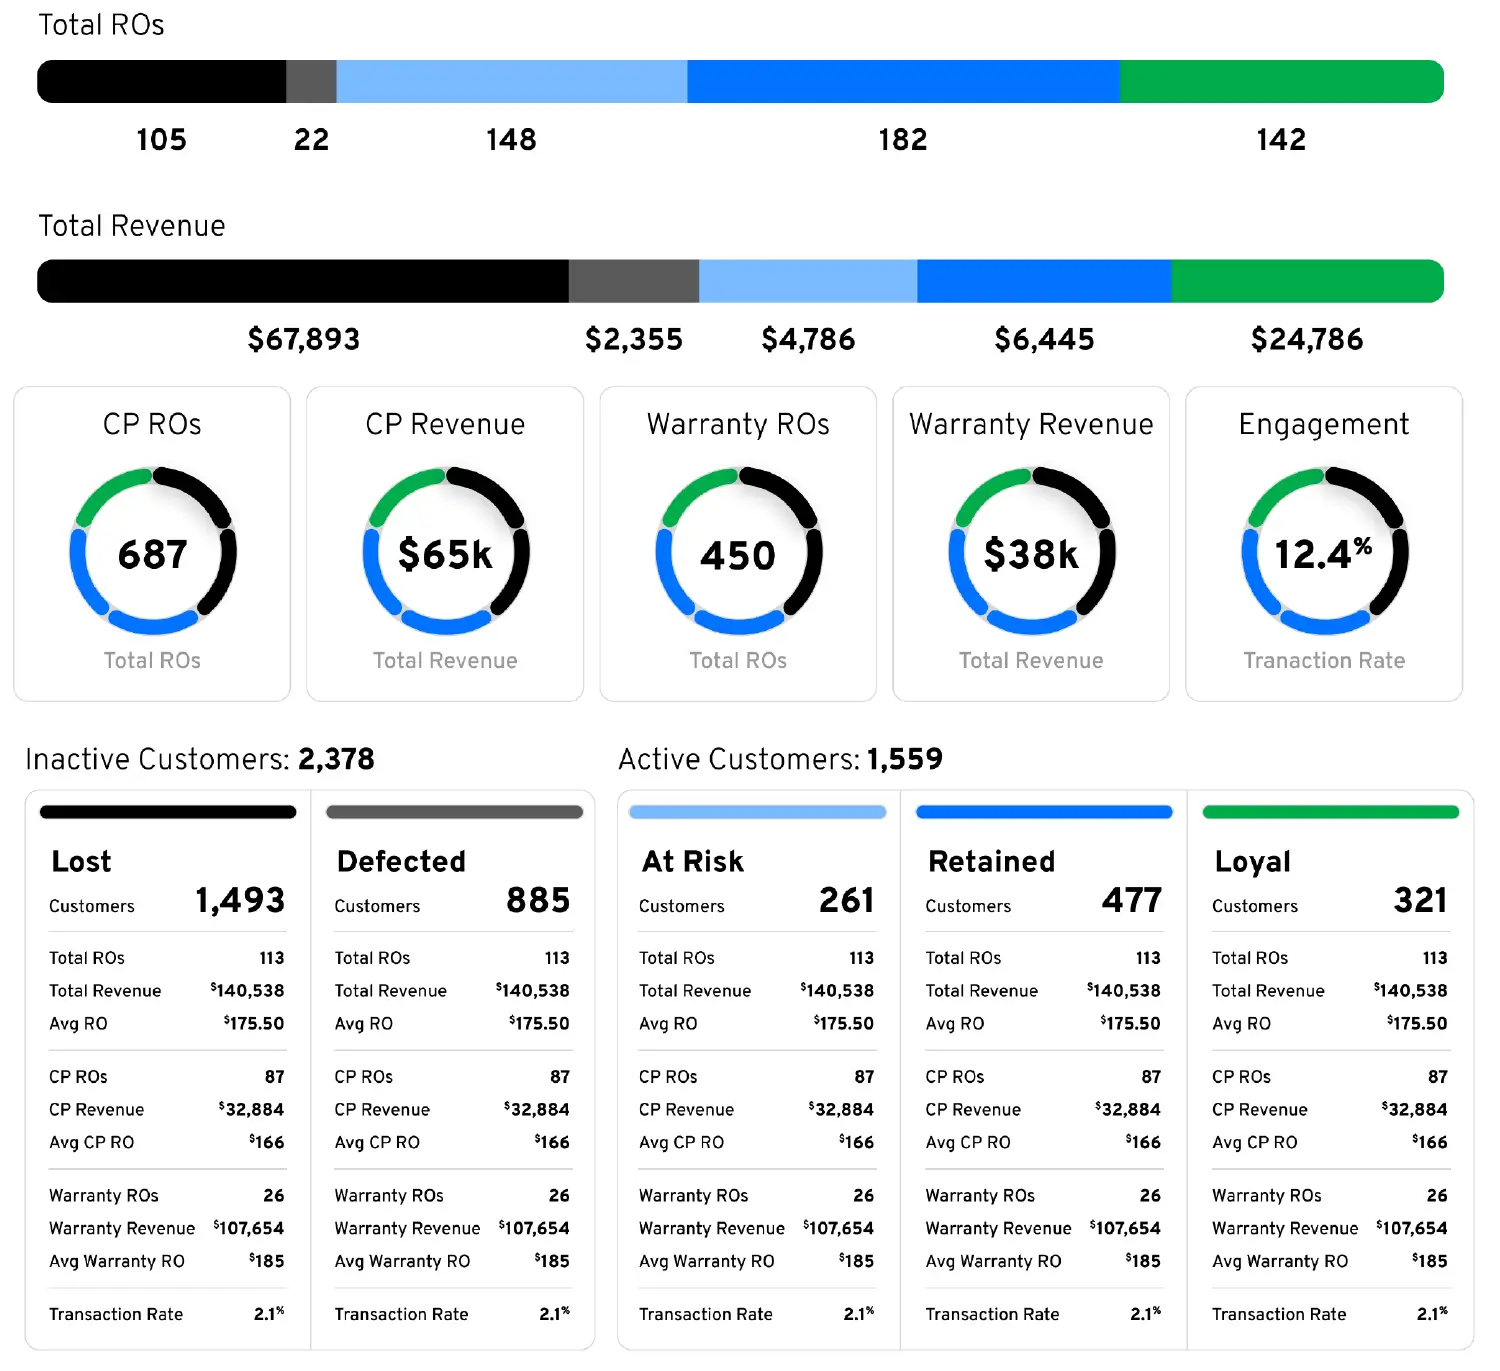
Lost, at-risk, loyal, sold-not-serviced, recall, and declined service segments give leadership a meaningful way to prioritize outreach.
Budget opportunities
Better analytics help dealers shift budget away from weak audiences and toward customers who represent stronger opportunities.
Transparent reporting
We do not believe vendors should take credit for every customer. Dealers need reporting that helps them make better decisions.
Examples
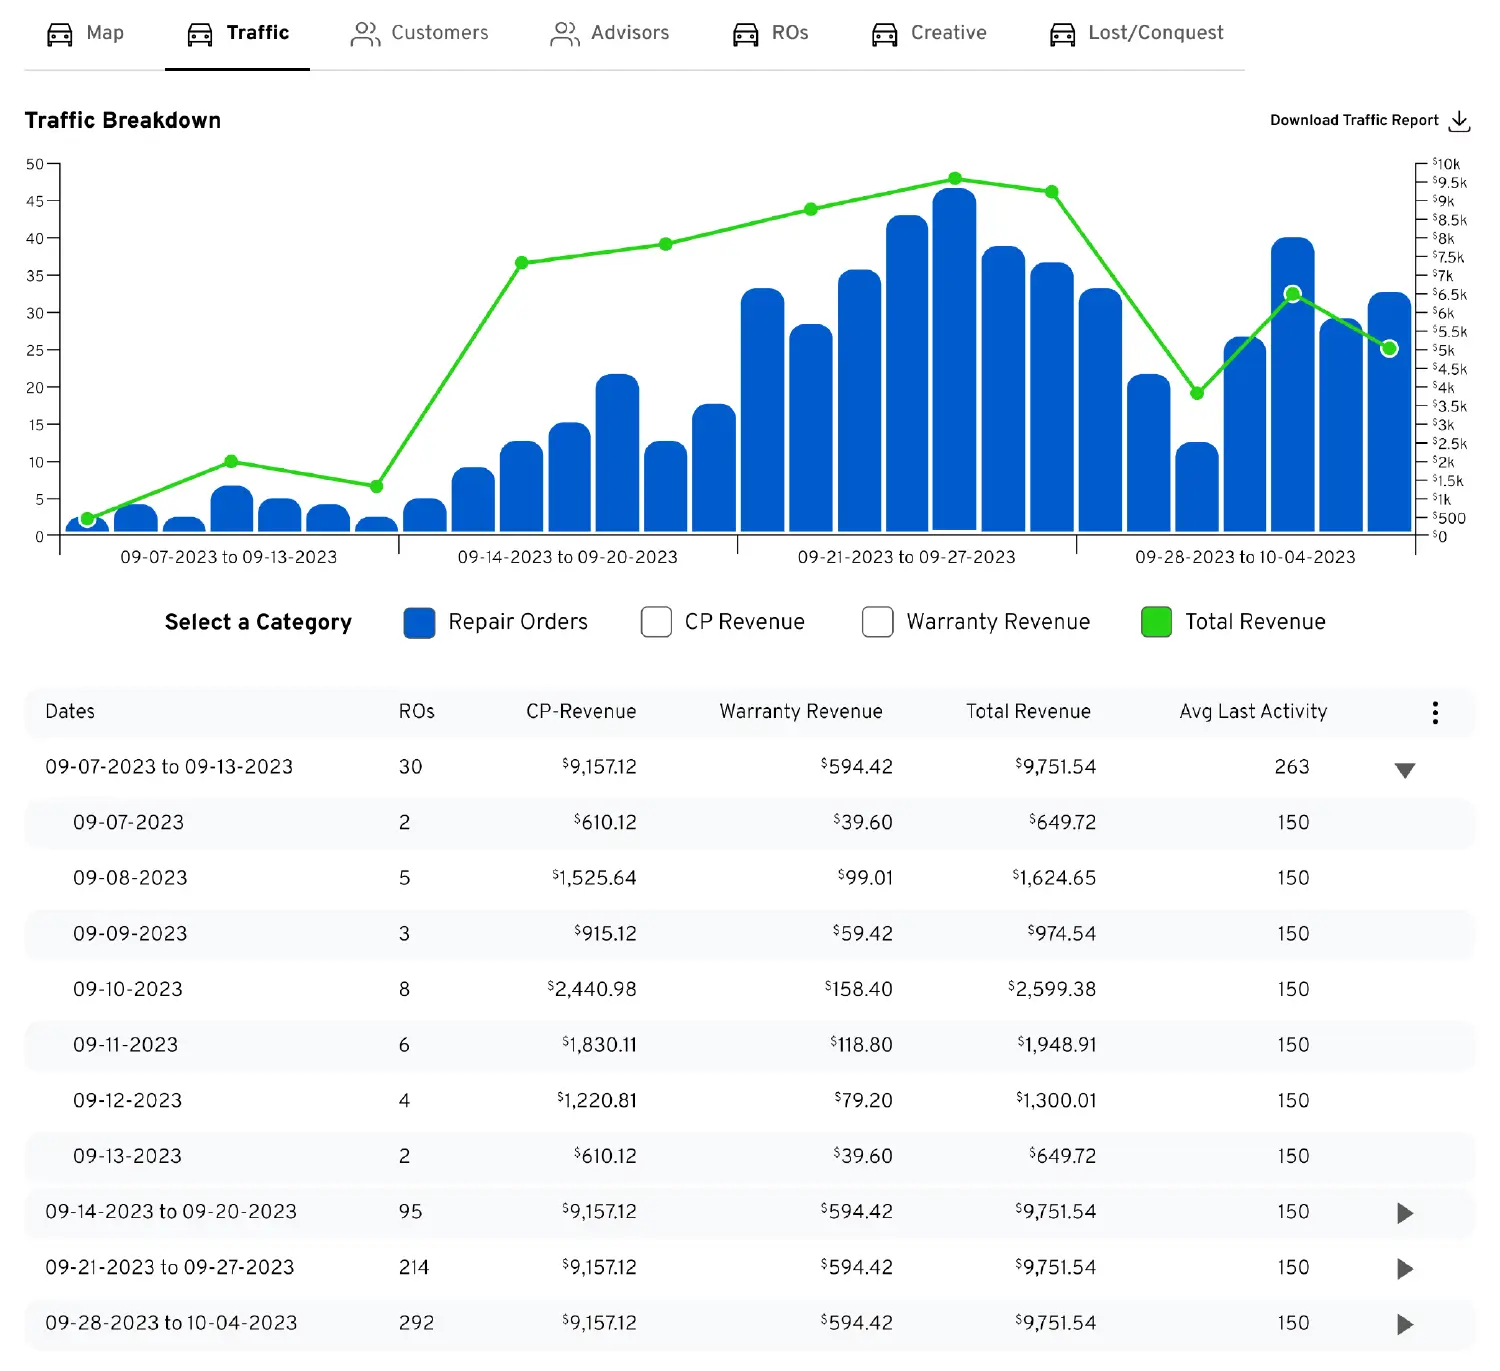
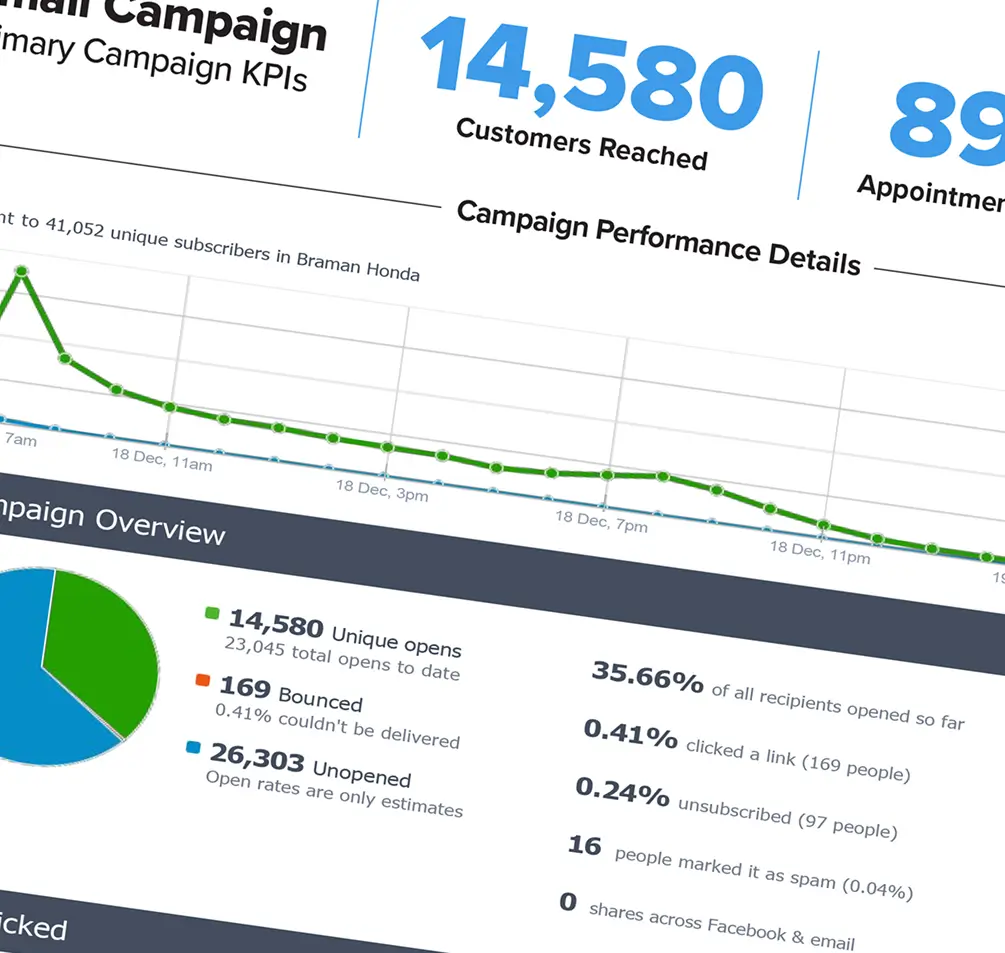
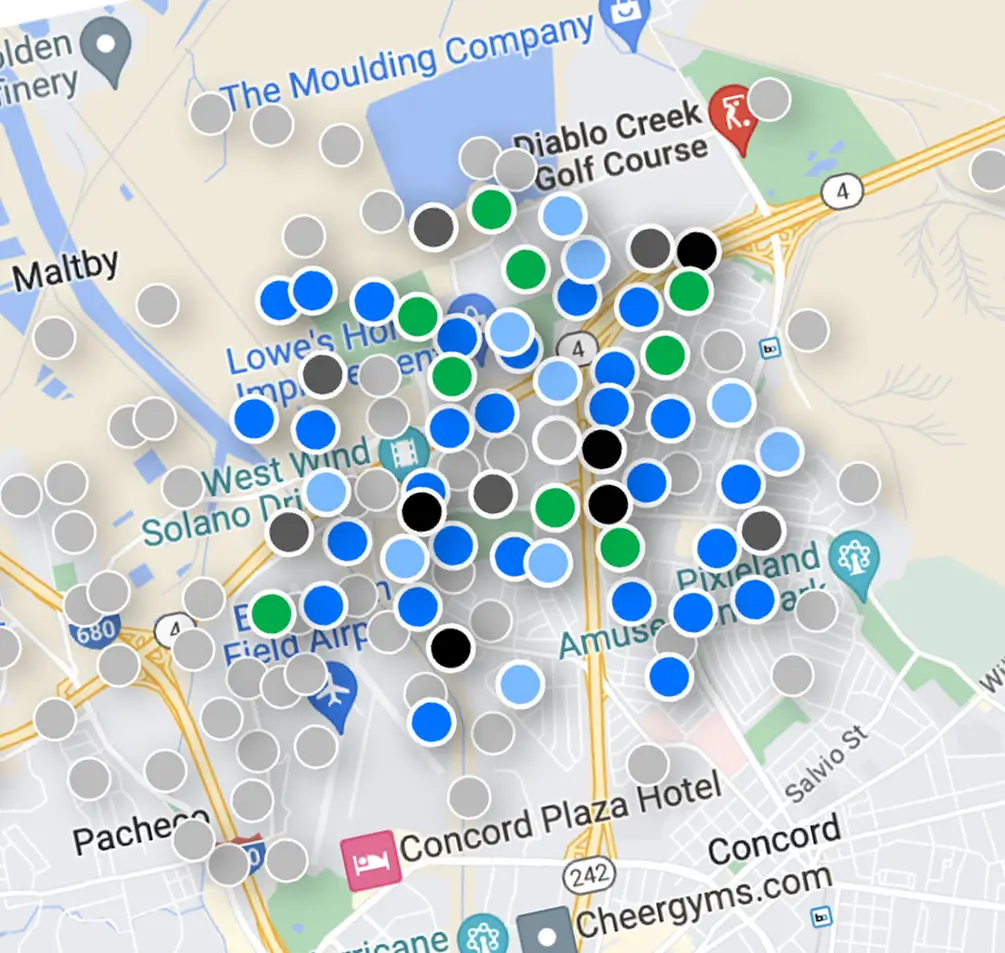
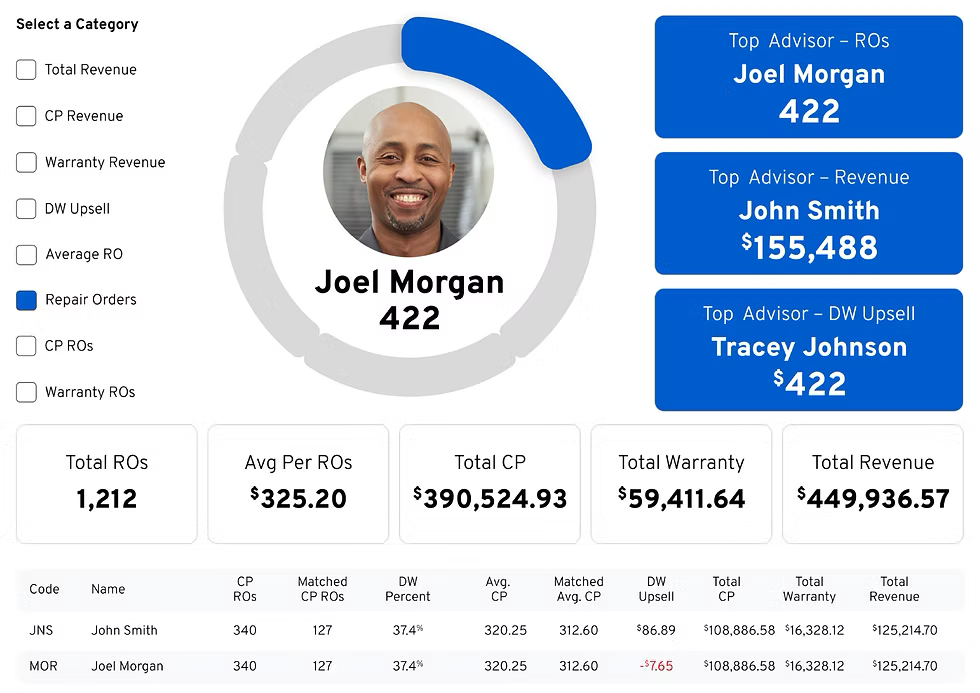
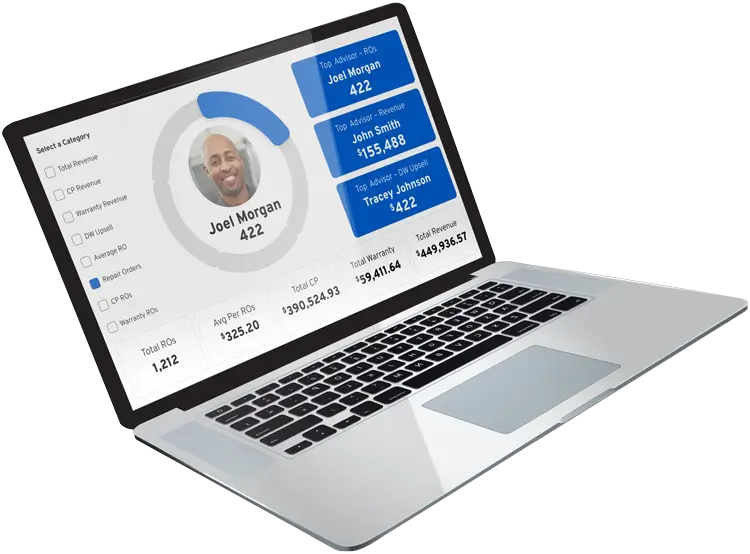
Reporting your controller can check
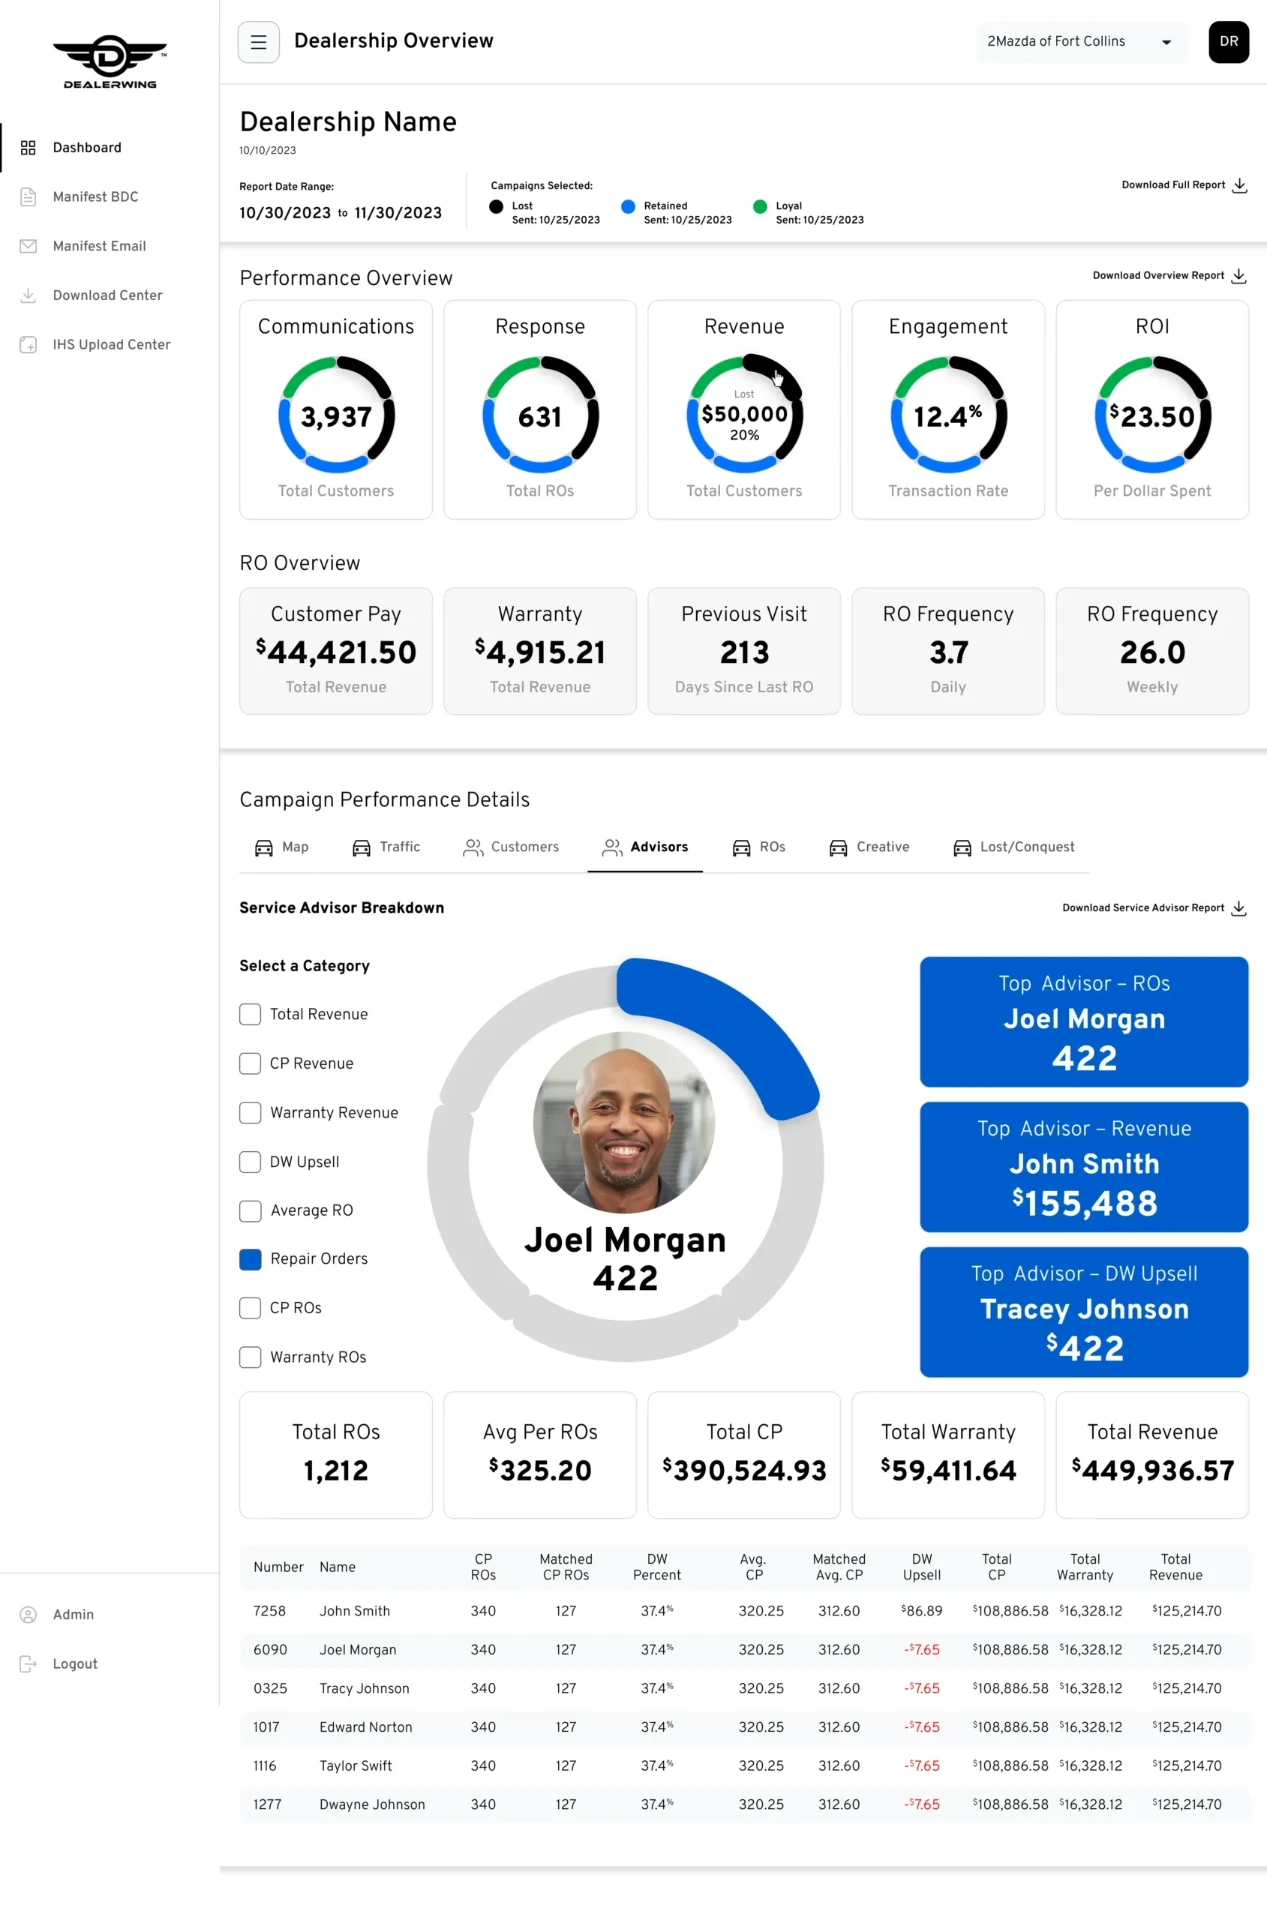
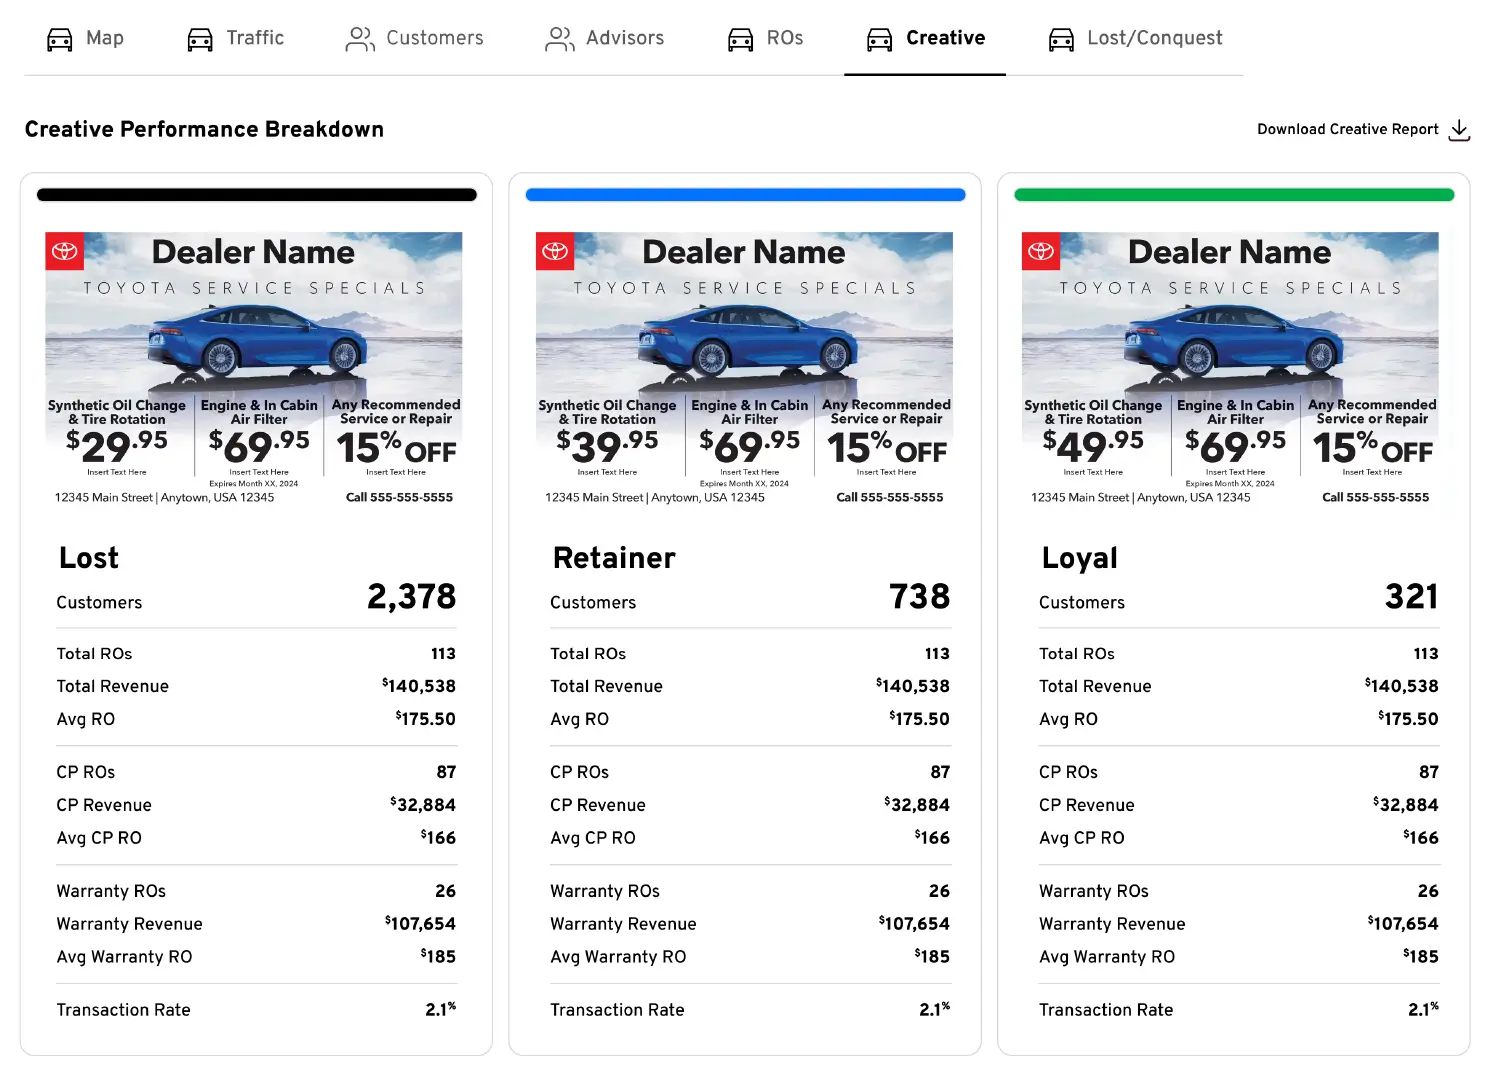
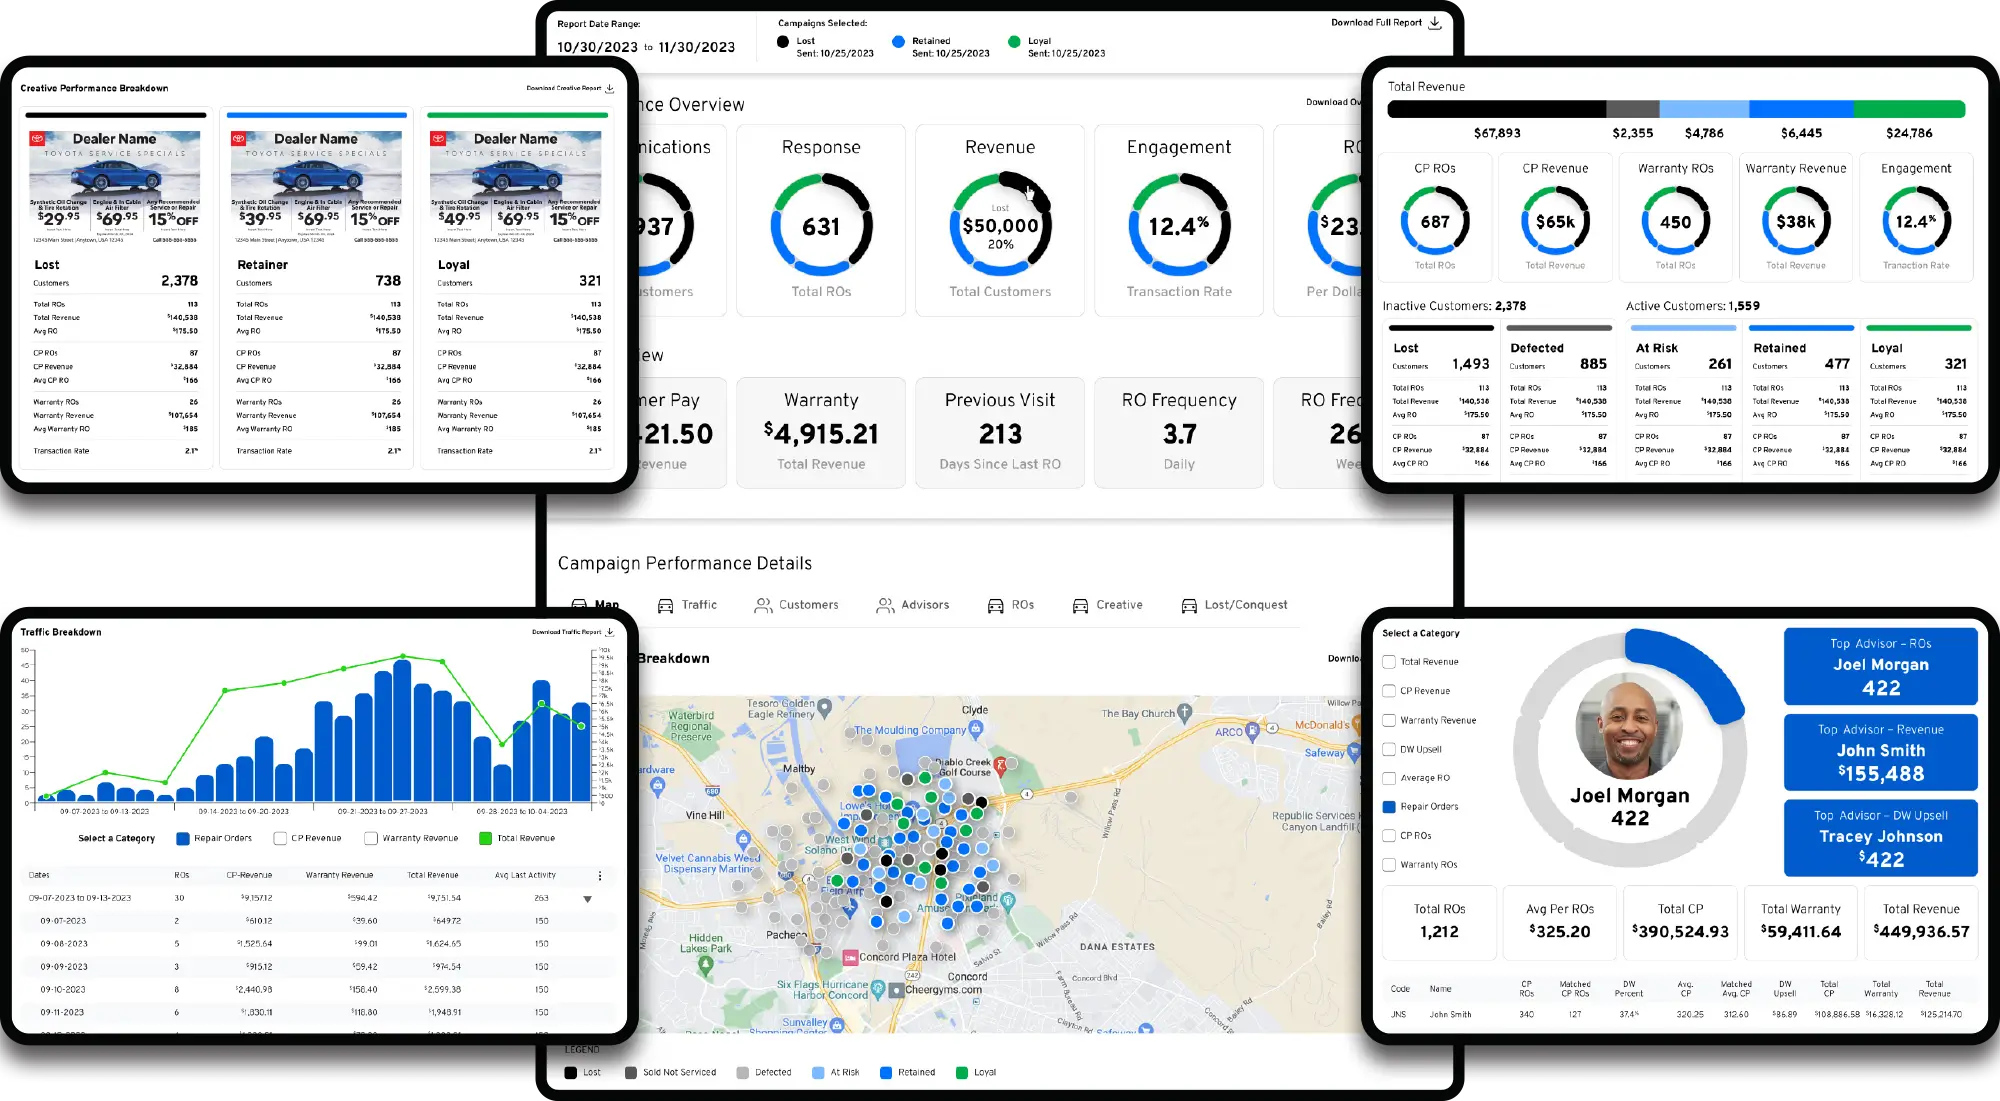
Product screenshots and sample collateral shown with placeholder dealer names and offers.
How it works
A process built on validated data
See flagged records
The dashboard surfaces flagged, questionable, or unusable records before they distort targeting or reporting.
Segment customer status
Customers are organized by lost, at-risk, loyal, sold-not-serviced, recall, and declined service status.
Build BDC action lists
Downloadable target lists with appended offers give the BDC a focused, practical bridge to the service drive.
Report with transparency
Granular reporting shows campaign activity, customer response, and attribution leadership can trust.
Use cases
Built for the Campaigns That Drive Fixed Ops Growth
Dashboard intelligence turned into targeted campaign strategy.
Service retention campaigns
Keep customers connected to the dealership.
Service retention campaigns help keep customers connected to the dealership before they defect to the aftermarket.
Recall campaigns
Drive appointment opportunities from recalls.
Recall campaigns target selected recalls and drive appointment opportunities with ownership-aware targeting.
Declined service campaigns
Bring back recommended work.
Declined service campaigns bring customers back for previously recommended work.
Sold-not-serviced campaigns
Reconnect buyers to the service lane.
Sold-not-serviced campaigns reconnect buyers to the service department after purchase.
Lost customer reactivation
Prioritize customers who fell out of the cycle.
Lost customer reactivation campaigns identify and prioritize customers who have fallen out of the service cycle.
Conquest and lost soul campaigns
Find opportunity outside your active base.
Conquest and lost soul campaigns identify market opportunities outside the active service base.
Holiday and seasonal campaigns
Capture timely service needs.
Holiday, seasonal, and specialty campaigns support timely service needs throughout the year.
BDC follow-up campaigns
Give the BDC a focused list to work.
BDC follow-up campaigns are built from targeted customer lists instead of broad, generic records.
Deep dive
Inside the Dealerwing Analytics Dashboard
How Dealerwing turns raw dealership data into a fixed ops command center.
FAQ
Common questions
What is a dealership analytics dashboard?
A dealership analytics dashboard is a reporting and intelligence tool that helps dealership leaders understand customer data, service opportunities, marketing audiences, campaign performance, and business trends in one organized view.
How does Dealerwing's dashboard help fixed operations?
Dealerwing helps dealers identify customer status, flagged records, market opportunities, BDC action lists, campaign audiences, and reporting insights that support service retention, recall marketing, declined service recovery, and other fixed ops growth strategies.
Why does data quality matter in dealership analytics?
Analytics are only useful when the underlying data is accurate. Duplicate records, outdated ownership data, bad contact information, and out-of-market customers can distort reporting and lead to poor marketing decisions.
Can the dashboard help the BDC?
Yes. Dealerwing can support downloadable customer lists with appended offers that can be used by the BDC for targeted follow-up.
Does Dealerwing take credit for every customer?
No. Dealerwing's messaging emphasizes transparent attribution and avoids claiming every customer who enters the service drive. The dashboard is positioned around clearer reporting and better decision-making.
Who should use the Dealerwing dashboard?
The dashboard is designed for dealer principals, general managers, fixed operations directors, service directors, marketing directors, BDC managers, and dealer group leadership.